Instagram ER% Checker
Engagement Rate Calculator Tools
An engagement rate calculator for celebrity and influencer Instagram accounts, helping you assess their performance, evaluate whether a paid partnership offers good value, or check the quality of a specific Instagram account.
How to Use the Engagement Rate Tool
To calculate an Instagram account’s engagement rate, start with the username or profile link of the account you want to check, then follow the three steps below.
1. Enter an Instagram Username or Profile Link

Copy the username or profile URL of the account you want to check, then paste it into the tool’s Instagram username or profile link field. Make sure you enter the correct Instagram username, not the display name shown on the profile.
2. Calculate the Account’s Engagement Rate
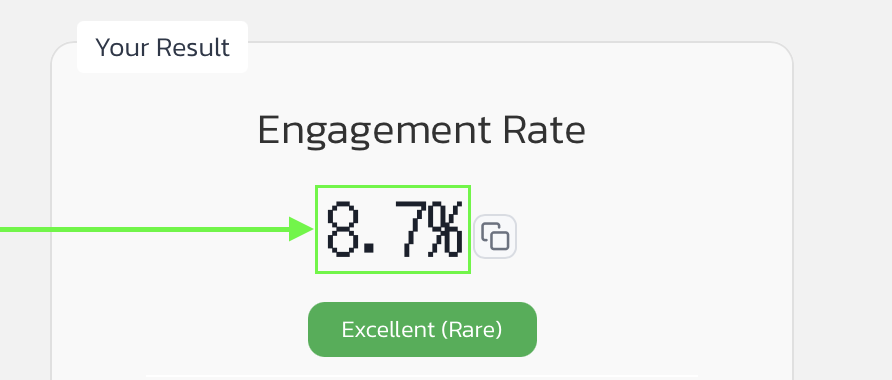
Once you have entered the details, click Calculate to see the Instagram account’s engagement rate (%), follower count, likes per post, and comments per post.
3. Copy or Download the Results
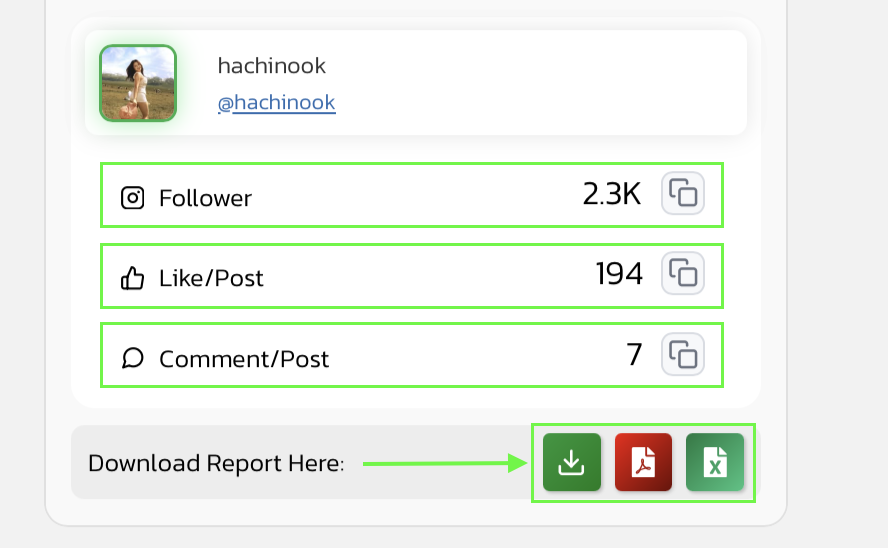
Once the engagement rate results are fully displayed, you can download an XLS file or copy the data to use when planning influencer marketing campaigns with that account.
Example Result
Engagement Rate
4.5%
Excellent (Rare)

Instagram Username Appears Here
@Instagram Link Here
Follower | |
Like/Post | |
Comment/Post |
Download Report Here:
What Is Instagram Engagement Rate?
Instagram Engagement Rate, or ER%, is a measure of engagement with content, expressed as a percentage. When using follower count as the basis, it compares the interactions posts receive with the number of followers to show how much engagement an account generates relative to its size.
For example, if two influencers have the same number of followers but one receives more likes and comments per post, that influencer will have a higher ER when calculated using the same formula. This metric helps you shortlist accounts before hiring, but you still need to assess whether their content and audience are a good fit for your product. To learn about other types of engagement, including shares, saves, and link clicks.
How to Calculate Instagram Engagement Rate
To calculate follower-based ER using only likes and comments, use the following averages per post
ER% = [(Average Likes per Post + Average Comments per Post) ÷ Follower Count] × 100
Here is an example for an Instagram account with 10,000 followers
|
Metric |
Value |
|---|---|
|
Follower Count |
10,000 |
|
Average Likes per Post |
450 |
|
Average Comments per Post |
50 |
|
Average Total Interactions per Post |
500 |
|
Engagement Rate |
5% |
In this example, dividing 500 by 10,000 and multiplying by 100 gives an ER of 5%. However, this does not mean that 5% of followers actually engaged, because people who like or comment may not follow the account, and one person may contribute more than one interaction.
How to Use ER to Shortlist Influencers
1. Prioritize Accounts Relevant to Your Product
Start by looking at the Instagram account’s content and the interests of its followers. For example, a cosmetics brand should review the creator’s beauty content and product reviews. An account in another niche may have a higher ER, but that does not necessarily mean it can connect more effectively with people interested in buying cosmetics.
2. Review Previous Sponsored Content
Everyday posts and sponsored product reviews may generate different levels of engagement. Before hiring an influencer, check whether they present products naturally and whether the comments discuss the product, ask about pricing, or enquire where to buy.
3. Compare Fees Against the Scope of Work
Consider ER alongside the influencer’s fee, the number of deliverables, content formats, and content usage rights. A higher fee may already include production or permission to run the creator’s content as paid ads, so compare the full scope of each proposal before making a decision.
Limitations
1. Results Depend on the Public Data Available
The ER tool can only process publicly available data and cannot access all of an account’s internal analytics. Since the formula counts only likes and comments, the result excludes saves, shares, direct messages, and other interactions that may be important to your assessment.
2. Certain Posts Can Skew the Engagement Rate
Viral posts, revealing photos, giveaways, or content tied to a short-lived trend may attract more engagement than the account’s typical posts. Including them in the average can make the Instagram account’s ER appear higher than its usual performance would suggest.
3. ER Cannot Detect Fake Followers
ER alone is not enough to determine whether an account has purchased followers, and a high ER does not confirm that every interaction comes from a genuine viewer. Assessing account quality always requires additional information.
How to Read an Instagram Account’s ER% Results
|
Result |
What It Shows |
|---|---|
|
Engagement Rate (%) |
The proportion of engagement calculated using the stated formula. |
|
Follower Count |
The size of the account’s follower base when the data was collected. |
|
Likes per Post |
The likes received per post in the sample used for the calculation. |
|
Comments per Post |
The volume of comments, which should be assessed alongside what people are saying. |
Once the results appear, review the engagement rate alongside follower count, likes per post, and comments per post to understand both the proportion and volume of engagement. An account with many comments may be receiving product questions, or it may be attracting debate. Reviewing the figures alongside the actual posts helps you choose influencers who are a better fit for your campaign.
Guide for Engagement Rate (%) Levels
Sixtygram’s ER calculator groups results into six levels, ranging from Low to Excellent, with color-coded labels to make them easier to interpret. The tool uses the following thresholds
|
Engagement Rate (%) |
Level |
Color |
|---|---|---|
|
Below 1% |
Low |
Gray |
|
1% to less than 2% |
Fair |
Yellow |
|
2% to less than 3% |
Moderate |
Light Orange |
|
3% to less than 4% |
Good |
Light Green |
|
4% to less than 6% |
Very Good |
Dark Green |
|
6% and above |
Excellent (Rare) |
Bright Green |
For example, an account with an ER of 3.5% receives a Good label, while an account with 6% falls into Excellent, the tool’s highest level. However, these levels are Sixtygram’s preliminary assessment criteria, not a fixed Instagram standard. Before hiring an influencer, consider account size, content type, and comment quality to assess whether the engagement reflects interest from the customers your brand wants to reach.